LoadTracer - Recorder
Recorder act as a proxy server between web browser and the web server, it record all the interaction between browser and server in the form of script file. It is also
possible for the recorder module instead of connecting directly to the web server, can be connected to another proxy server just by specifying proxy address and port number in
Settings dialog. Before recording the script we can enable or disable the client cache option. If the web pages, which are going to record, are already cached in the Temporary
Internet Folder, by disabling this option we can get entire response from web server otherwise pages are taken directly from Temporary Internet Folder.
To record a new script, Click New Script or Ctrl+N, and then Click Start Recording or Press F5
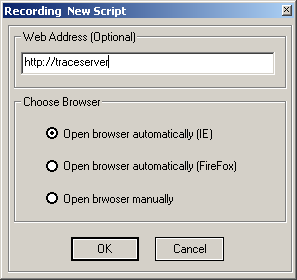
- Web Address : To specify URL to which the script going to be record. It is a optional field.
- Open Browser Automatically (IE) : By selecting this option the Internet Explorer will open automatically just on pressing OK button
- Open Browser Automatically (FireFox) : By selecting this option the FireFox will open automatically just on pressing OK button
- Open Browser Manually : Browser has to be manually open by the user after clicking OK button. Browser's proxy settings also has to manually set by the user other wise
recording will not work
- Note : If the recording is started using Open Browser Automatically Option then don't close the browser using close button just Click Stop Recording in Recorder,
browser will close automatically.
- Click 'New Script' from toolbar or from menu File -> New Script
- Click 'Start Recording' from toolbar or from menu Test -> Start Recording... or press F5
- Enter web address in the recording dialog box and press enter.
- Browse through the web application and press 'Stop Recording' from toolbar or from menu Test -> Stop Recording or press F6
- Save the script

Recorder Port No: This port number is used in Internet Explorer LAN settings, to redirect all operations through LoadTracer - Recorder.
Default value is 9555
Client Cache Setting:
Disable Client Cache: The web pages, which are going to be recorded,
if it is already cached (exist) in the Temporary Internet Folder, by using this option we can get entire response from web server, even if the file is already in the
client machine
Enable Client Cache: If file already exist in Temporary Internet Folder which are going to be recorded, the browser first check
the file in server, if there is any modification occurred since the file is cached in client, if not browser retrieve cached file otherwise complete file is obtained from
server.
Proxy Server:
Instead of directly connecting to main server we can connect through a proxy server. Proxy Name is the machine name where the
proxy server exists and Port No is where the proxy listening.
Select Report Color:
Six different colors are available to generate the brief and detail
reports.
HTTP Version:
To use HTTP 1.0 uncheck this option. By default recorder will use HTTP 1.1
Display Snapshot:
HTML
will be rendered in HTML tab if this option is checked.
To generate dynamic and unique values for each virtual users while simulation process, script has to be parameterized. The figure A shows sample parameters.
When particular file is selected, all its existing parameters are displayed in parameter tab.

Figure A
Add: To add new parameter, click Add button, and enter name and value.
Remove: To remove a parameter, select a parameter and click Remove button.
Edit: To edit a parameter, select a parameter and click Edit button and edit name and value.
Parameterization: To parameterize, select a parameter and click Parameterization button.
Parameterization window will be opened. (Figure B)
Note: In the above figure the third column Parameterization Function, shows the type of
parameterization is used.
For Example: @Default - means this parameter is not yet parameterized, so during simulation
default value (recorded value) will be used.

Figure B
In the above figure, the right most pane 'All Modified Parameters' shows the parameters which are
already parameterized. It shows FId - File Id, PId - Parameter Id, and parameter name. To update these parameters, select the parameter in the pane, edit and click SET button.
Note: To update parameterization SET button has to be clicked.
FUNCTIONS
- @Default -When a parameter is first selected for parameterization by default this function is used, which means its not parameterized so default value (Recorded value)
will be used in simulation process. It should be noted here that, to remove the parameterization for a parameter again this function has to be used.
- @FromFile - When this function is selected, browse button option will be enabled, user just has to set the file path. So during simulation process data for each
virtual user for this parameter will be fetched from this file. This file should be in line separated format i.e, one value in single line.
For Example: To simulate 10
virtual users, 10 username can be stored in this file, each name in single line. If user provide just 5 names for 10 virtual user then 6th vuser will fetch the first value, 7th
will second value and so on.
- @VUserId - This function return its vuser id, only Width field will be enabled for this function.
For Example: If this function is used, vuser 1 will have the
value 1, vuser 2 will have the value 2 and so on. We can also specify width field, if width is 3, value will be returned as 001, 002, 003, .. 010.. so on.
- @IterationId - This is similar to above function but it return current iteration count of particular virtual user. Width is allowed for this function.
- @String_VUserId_IterationId - For this function user can enter a String(optional), use underscore(optional) and width(optional).
For Example: sample output from
this function
|
| String |
Width |
Use "_" |
Output |
| abc |
0 |
checked |
abc_1_1, abc_2_1, ... |
| xyz |
0 |
unchecked |
xyz11, xyz21, ... |
| pqrs |
3 |
checked |
pqrs_001_001, ... |
| |
4 |
unchecked |
00010001, 00020001, ... |
|
- @String_IncrementValue_String - Input from user is String1 (optional), Initial Value (optional) if not mentioned 0 is taken as default value, String2 (optional),
Use "_" (optional), Width (optional).
For Example: sample output from this function
| String |
Init Val |
String |
Width |
Use "_" |
Output |
| ab |
5 |
xy |
0 |
checked |
ab_5_xy, ab_6_xy, ... |
| aaa |
|
bbb |
0 |
unchecked |
aaa0bbb, aaa1bbb, ... |
| xyz |
10 |
|
3 |
checked |
xyz_010_, xyz_011_, ... |
|
500 |
xxx |
0 |
unchecked |
500xxx, 501xxx, ... |
|
- @String_RndValue_String - Input from user is String1 (optional), Rnd Initial Value (optional) if not mentioned 0 is
taken as default value, String2 (optional), Use "_" (optional), Width (optional).
For Example: sample output from this function
| String |
Rnd Init Val |
String |
Width |
Use "_" |
Output |
| abc |
100 |
xyz |
0 |
checked |
abc_85_xyz, abc_24_xyz, ... |
| aaa |
|
bbb |
0 |
unchecked |
aaabbb, aaabbb, ... |
| xyz |
50 |
|
3 |
checked |
xyz_027_, xyz_049_, ... |
|
500 |
xxx |
0 |
unchecked |
399xxx, 249xxx, ... |
|
- @Cookie - - In some applications cookie values are used as input for example session id which cannot be generated automatically. Instead the simulator will
take the cookie value automatically from the current process. The cookie value will be taken from one of the previous response header.
Here only String field is used to
specify the cookie name whose value has to be taken during simulation process.
For Example:
If cookie name is PHPSESSID, the current session id will be automatically
taken.
- @UseVariable - Input from the user is only Variable name, from the variable values will be fetched. Befor using a variable, it has to be created. For Example:
In .Net __VIEWSTATE values are posted from the previous page request, so using variable we can fetch the run time values of __VIEWSTATE and post back to the next
request.
- @Static - - Input from user is one string value which is used by all virtual users.
- Select a file whose parameter to be parameterized.
- Double click a parameter from Parameter tab or select a parameter and press Parameterization button
- Select appropriate function for the selected parameter and enter required values in the field provided and press SET button
- To deparameterize a parameter select the parameter, click @Default function and SET button
LoadTracer will extract the values from server response and assigns to variable, which can be used in parameterization. Usually variables are used for sessionid, viewstate,
etc, mostly this types of values are stored in hidden form element.
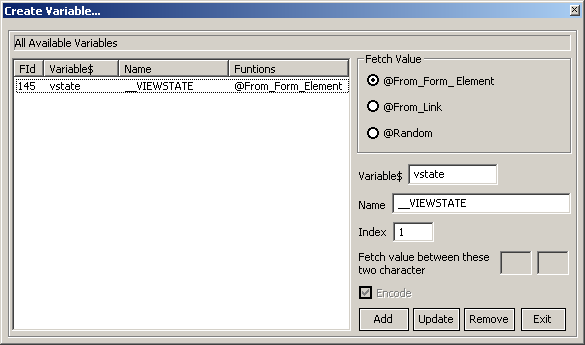
Figure A
To add a variable, first select a file in script pane and goto Test -> Create Variable... or Press F9
Add: To add new variable, enter a variable name in
Variable$ field and Name field will be depends on the type of funtion used which will be discussed later. Index default value will be 1 for example its possible in HTML there will be two text box with same name, if value has to be extract from second text box index value should be 2. The
variable name must be unique in same file for example if a variable is created by the name 'TMP1' in file no 3 then its not possible to create TMP1 again in same file, but
allowed in other files.
Update: To update existing variable.
Remove:To remove a variable, select a variable and click Remove button, but variable
should not be in used i.e, it should not be used in parameterization otherwise it will not be deleted.
In the above figure, the right most pane 'All Modified Parameters' shows
the parameters which are already parameterized. It shows FId - File Id, PId - Parameter Id, and parameter name. To update these parameters, select the parameter in the pane, edit
and click SET button.
Note: To update parameterization SET button has to be clicked
FUNCTIONS
- @From_Form_Element -Using this function values can be extracted from html form element like text, hidden.
For Example
<input type="hidden" name="counter" value="55" />
<input type="hidden" name="__VIEWSTATE" value="/wEPDwULLTExNjU4N=" />
Variable$ : vstate (user defined name)
Name : __VIEWSTATE (whose value to be extracted) - form element name.
Index : 1
At simulation time the value part of __VIEWSTATE will be assigns to vstate, which can be further used in
parameterization.
- @From_Link - Values can be extracted from
html link.
For Example
<a href='search.asxp?hl=eng&cnt=4445&idx=33'>Click Here</a>
To extract value of cnt from above link:
Variable$ : vcnt (user defined name)
Name : cnt (whose value to be extracted).
Index : 1
At simulation time the value '4445' will be assigns to vcnt, which
can be further used in parameterization.
- @Random - Using this functions values
can be extracted randomly any where from the html source.
For Example:
<h5><label for="searchInput">Search</label></h5>
<div id="searchBody" class="pBody">
To extract the value 'Search'
Varaible$: var1 (user defined name)
Name : searchInput (this is search string).
Index : 1
Fetch value between these two character: > <
LoadTracer will first search the string 'searchBody' after that it extract the value between
these two characters > < and assigns to var1.
Encode: Extracted values should be encoded before using it. If the value is already encode uncheck the
Encode button.
Response from the server can be validated using Response Validator functionality. In some application internal server error messages are shown in custom format in that case
instead of 500 Internal Server Error response code, 200 OK will be returned. So we can check the response content from the server and validate the data.

To add a response validator, first select a file in script pane and goto Test -> Response Validation... or Press F10
Check Validate checkbox and select one of the three
options.
- Pass If Response Size Is Greater Than - specify size in bytes, the validation is true only if response data size is greater than specified size.
- Pass If Response Size Is Less Than - specify size in bytes, the validation is true only if response data size is less than specified size.
- Pass If Response Contain Following Sentence - Enter search string in the text box, response is pass only if the specified string is exist in the response data.
If 'Not' Checkbox is checked validation is pass if specified string is not exist in response data.
To change the settings of individual request select the file from script pane change the settings and click SET button.

Figure A

Figure B
Server : Web address or server name
Port No : Port number of server, http default port number 80, https default port number 443
URI : Seconday address of URL.
Enabled: If this checkbox is checked this file will be simulated, other wise ignored in simulation process.
Think Time: Time taken by user between page click.
Protocol: HTTP 1.0 or HTTP 1.1
Secure: Checked if https otherwise http request.
Set: Update the settings for current node.
Set All: Update the settings for all the node.
Two types of reports can be generated from the recorder module. A brief report and detail report which can be saved in HTML format
The above figure shows the brief report generated by the Recorder module
Page section shows only primary page name for example if 'home.asp' contains
images the detail of the images will not be shown in this report and the time taken and bytes details of the secondary files are added to primary file itself
Request Time is the time taken to submit it request header from client to web server, but in the Recorder module ReqTime is represented as Request Time + User Think Time.
Think time is the time taken by the user between two pages.
Response Time is the time taken to receive entire bytes from web server for a particular request
Bytes Send is the total number of request bytes send to the web server
Bytes Received is the total number of response bytes received from the web server

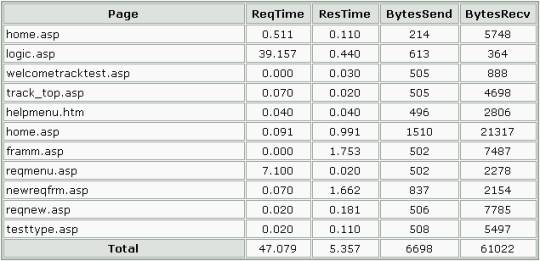
The above figure shows the portion of detail report. See the Brief report 6th file 'home.asp' and compare with above report.
In the above example 'home.asp' is the
primary file which also contains secondary files like, css, gif etc., so each will have its own request and response detail
LoadTracer - Simulator
Simulator can able to generate up to several thousand virtual users but the exact figure is depend upon complexity of the script, hardware, used. In real scenario
different users access different pages on the same website, to emulate this scenario first different script has to recorded with different activities, and then you can add
as many as scripts to a test. These scripts in the test can be made to simulate concurrently or sequentially. In sequential method each script is simulated in one at a time
way, once a simulation of one script is over, automatically another script will be started. In concurrent method all the virtual users of all the script is released at the
same time.
A Test is collection of script.

To create a new test first browse the folder which contains recorded script. The script will be shown in the 'Available Script' pane. Select the script and add to
Test. Once the necessary scripts are added to the test click ok and save the the test. To remove the script from the test just select the script from the Test and click
Remove.
A Test may have any number of script and there is no limit.
After creating new test the settings of the each script in the test can be modified using 'Test Settings' dialog box.

Scripts: This pane shows all the scripts which is selected in the current Test. To modify the settings select the script change the settings and click 'Apply' otherwise
settings will not be changed
Virtual User: Number of virtual users to be created for this particular script, vuser limit depends on LoadTracer license.
Iteration: By default every vuser perform one iteration. To perform more than one iteration use this option. It can be done in two ways, Iteration by Numbers for example if the
value is 5, all the vusers in this script will perform 5 iterations. Iteration By Time, in this method we have to specify time in minutes for example if the value 10 min, the
script run for 10 min and perform as much as iteration possible with in the time limit.
Note: This option can be override by vuser scheduler option.
Think Time: Think time is the time taken by the user while recording between events. Using the first option 'Replay Think Time From Script' the simulator emulate the think time as recorded.
To modify the think time use second option enter value in seconds and milliseconds. To disable think time enter value zero.
Cookie: if the web application uses cookie this option should
be enable other wise the Test may fail.
Parameterization: If the parameterization structure is already created with Recorder module, this option should be enabled to implement parameterization.
If this option is used without creating parameterization structure the default value will be used i.e. the value used at the time of recording.
Validate Server Response: If the
response validation is already set in the script in Recorder module, then this option should be checked to enable response validation.
Unlike 'Test Settings' Options belongs to whole Test. If a option is changed it affect the entire script in the test.
Stop Option

A Test may contain more than one script and these script can be run sequentially or concurrently. Suppose each script is running sequentially and user wants to stop
the simulation process by pressing stop button. The simulation process will not terminate immediately it will stop only after completing current running script. To stop
immediately use second option, here the test will stop just completing the current request.
Add/Delete Vuser...

Before starting simulation process we can add and delete vuser to a script by clicking 'Add Vuser' and 'Delete Vuser' button in the tool bar. To add and delete more
than one vuser at a time use this option.
Time Out...
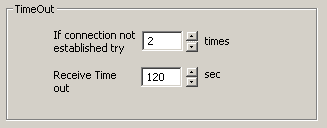
During the simulation process the simulator will try to connect with the server if the connection not established it will try for 2 times which is default option to try
more than 2 time change this option.
During simulation process the simulator send request to the server waits for server response, the simulator wait for 120 sec which
is default value if the simulator did not get any response from the server with in this time limit, simulator moves to the next request. To change the receive time out period
use this option .
Proxy...

A Proxy is a intermediate server instead of communicating directly with the server simulator can able to connect with the proxy server and redirect all its request
to proxy. To use the proxy server specify the proxy name (computer name) and port number where it is listening.
Iteration Speed...

Iteration is nothing but a vuser completes its process and repeat the process once again. Using this option we can give delay between each iteration or start the
iteration as soon as possible.
Error (Stop)...

During simulation process errors may occurs like, HTTP error like client side error with 4xx error code and server side error with 5xx error code, receive time
out error and Response Validation fail, to stop the vuser during these errors use first option. To continue even these error occurs use second option.
Vuser Log...
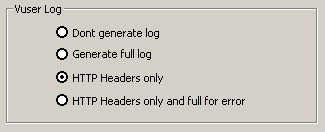
During simulation process full vuser log can be generated which contains request header, response header and html content. To log only HTTP header information use
third option. To log HTTP header and full content for error use fourth option.
User-Agent
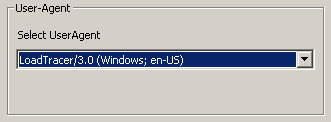
User-Agent is the client name used to interact with the server, in case of recording process it may be IE, or Firefox, or safari, etc, while simulation default
user-agnet name will be used as LoadTracer, but it can be customized to other client browser name like, IE, Firefox, Safari with different version.
Normal simulation process all the vuser start and goes from ready to running state at the same time, completes its process and terminates itself once
the process is completed. Using Virtual User Scheduler we can set the vusers when to start the process and when to stop.
Release...

Release all vusers concurrently is the default option where all the vuser goes from the ready state to running state almost at the same time, using second
option we can schedule the vuser to release N vuser for ever N sec. Here release means moving from ready state to running state.
Execute...
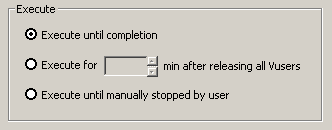
The default option is execute until completion, the simulation process start once completed it end the process. Using second option execute for N minute after
releasing all vuser once all the vuser moves from the ready state to running state it should simulate for N min. If the third option is used the simulator will never stop user
has to stop the simulation process manually by pressing stop button.
Windows performance counter log is integrated with the simulator. It runs independently with the simulation process. User has to just select the local computer counters
or remote computer counters from the counter selection window, start the log and at the end stop the log.
Use windows performance monitor to analyze the log file.To log
the performance counter go to Performance - > Browse Counter or press Ctrl+B. Select the counter and press OK.
In the Performance counter Pane select the necessary
counters by clicking the check boxes, and then go to Performance -> Start... A dialog box shows the performance log settings, click Start to begin the logging process. To stop
the performance log process go to Performance-> Stop.
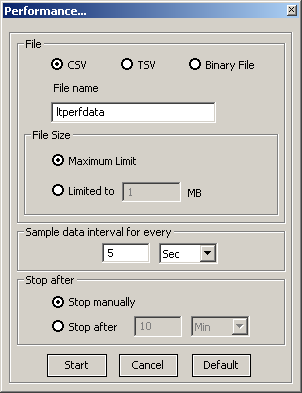
- Log File Format: Performance log can be saved in following file formats which is compatible with windows perfmon. CSV - Comma Separated Version, TSV - Tab
Separated Version, and Binary file format. Specify the file name in the text box.
Log file will be stored in following path "c:\ltperflog\"
- File Size: Maximum Limit is no limit on the file size, or user can limit the log file size by specifying the limit. Once file size reached the limit the performance
counter log will be stopped automatically.
- Interval: Log data will be collected for every specified interval of time
- Schedule: User can schedule to stop the log after it reach the time limit or user can stop the log manually.
This window shows the status of all the script in the test.

First column shows the name of the script, only the selected script is taken into the simulation process. Down column shows the number of vuser are down i.e. before starting the
simulation process once simulation started all vuser goes to Read state. If the vuser is scheduled then vuser goes to running state when its time comes. Passed, Failed, Stop
shows the result of the vuser after simulation process. Hits is number of request send to server. Bytes send is the total request bytes send to the server and Bytes Recv is the
total bytes received from the sever.
To open this window double click the particular script in script status pane

During the simulation process all the request from a script is simulated, to unselect a request from the script just uncheck the particular url and it will not be selected
into the simulation process.
This window shows the status of the all vuser of a selected script.

The above window displays the vuser status. Status column shows whether the vuser is down or running or passed or failed or stopped. Iteration column shows current iteration
number of total iteration given to execute. Script column shows the name of script. Server column shows the name of the machine to which the simulator generating load, and
elapsed time shows the time elapsed since simulation start.
This window show the detail information of each vuser to open this window just double click the vuser in Vuser Status window.
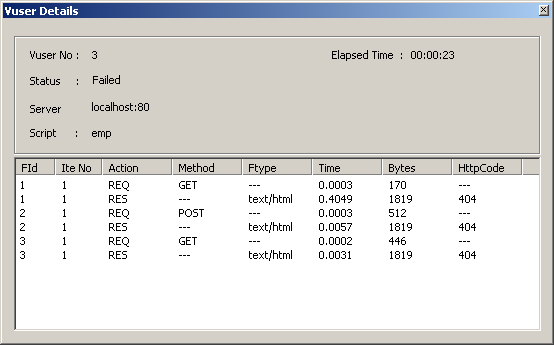
The above window shows the detail information of a vuser. FId is file id, Ite No is the iteration number. Action it will be any of the two action REQ - request or RES - response,
Request and Response detail are shown in separate line. Method shows which HTTP method is used in that particular request. Ftype is the file type which is received from the
server. Time is the time taken to completed that action. Bytes is the request and response size. HttpCode is the reply code from the http server.
This window show the detail information of each vuser to open this window just double click the vuser in Vuser Status window.
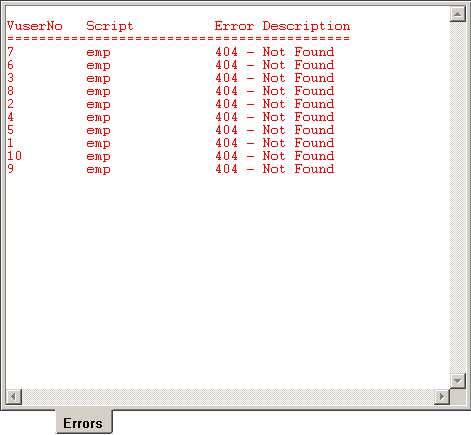
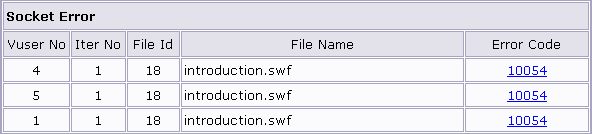
The above window shows the error with vuserno , script name which has generated the error and the error description. It may be possible error is generated by some thing else
other than vuser so a "-" mark is shown in the place of vuserno.


The above window is the status bar of simulator shows what are all the options that user has set. For example the first picture shows whether a proxy server has used or not,
a delay between iteration has given or not, script is simulated sequentially or concurrently, whether the vuser should stop on http error or not, how to log the vuser status,
and than vuser schedule images. To change the option just double click the image to open the dialog box or we can also go from tool bar button.
LoadTracer - Analyzer
Analyzer will produce many types of graph and reports for analysis purpose. These reports can be exported HTML format. Reports are based on virtual user detail,
request detail, classification-based reports and summary reports.
This pie chart shows the number of vuser pass, fail and stop.

Transaction Performance is based on the transaction of the virtual user
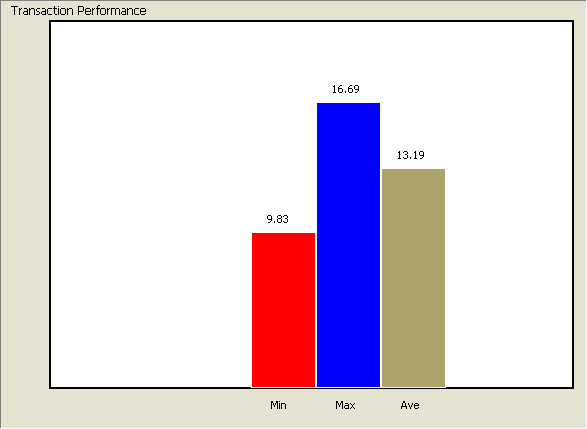
Min time taken by vuser to complete its process.
Max time taken by vuser to complete its process.
Average time taken by all the vuser to complete its process.
Web server return response with response header which contains the response code or HTTP Status Code.
HTTP Status Code specifies the status of the HTTP Request. For example if code is 200 - "Sucessful", 404 - "Not Found", 500 - "Internal Server Error".
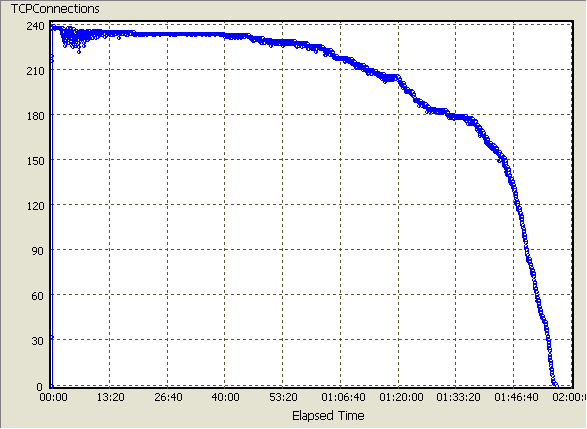
The Running Vusers graph displays the number of Vusers that are currently running. This graph is useful for determining the Vuser load on your server at any given time.
The x-axis represents the elapsed time from the beginning of the script. The y-axis represents the number of Vusers running in the given script.
 |
Bytes Send/Sec represent the number of bytes send to the web server by the client (simulator) in the form of request during each second of the simulation process.
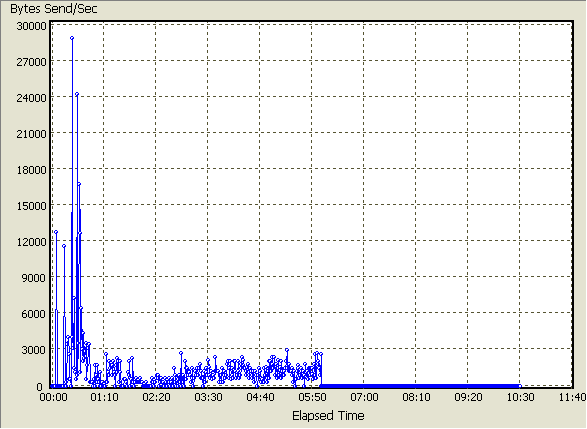
The x-axis represents the elapsed time from the beginning of the script.
The y-axis represents the number of bytes send to the server.
Bytes Recv/Sec graph shows the the amount of throughput on the server during each second of the simulation process. The amount of data received from the web server
at any give second.

The x-axis represents the elapsed time from the beginning of the script.
The y-axis represents the number of bytes received from the web server.
The Hits per Second graph shows the number of HTTP requests made by Vusers to the Web server during each second of the simulation process.

The x-axis represents the elapsed time from the beginning of the script.
The y-axis represents the number of Hits on the web server.
The Response per second graph shows the number of successful HTTP response given by the Web server during each second of the simulation process.

The x-axis represents the elapsed time from the beginning of the script.
The y-axis represents the number of response from the web server.
Text Files/Sec graph shows the number of text files (htm, asp, aspx, jsp, css, js, vbs, php, etc) received from the web server.

The x-axis represents the elapsed time from the beginning of the script.
The y-axis represents the number of text files received from the web server.
Binary Files/Sec graph shows the number of binary files (images, media files, etc) received from the web server.

The x-axis represents the elapsed time from the beginning of the script.
The y-axis represents the number of binary files received from the web server.
This graph represents number of virtual user successfully completes its process per second and number of virtual user fail per second The graph below shows the VUser
passed per second and VUser fail per second.

The x-axis represents the elapsed time from the beginning of the script. The y-axis represents the number of VUser passed during each second of simulation process.
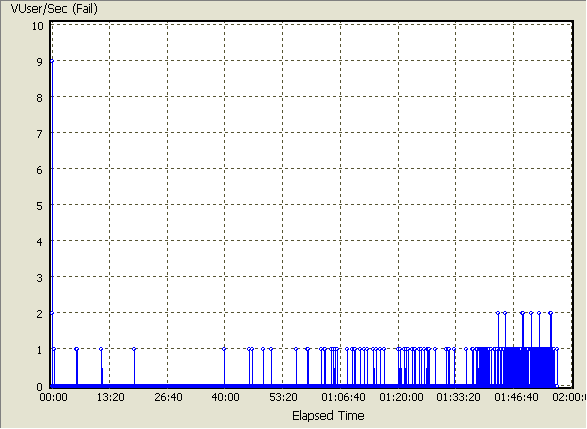
The x-axis represents the elapsed time from the beginning of the script.
The y-axis represents the number of VUser failed during each second of simulation process.
For each file there will be only two operation sending request (hit) and receiving data (Response) both this operation is represented as Action. This graph represent
number of action took place per second.

The x-axis represents the elapsed time from the beginning of the script.
The y-axis represents the number of Action completed by vusers during each second
of simulation process.
Percentile graph are generated by arranging all the vuser in ascending order according to transaction time of vuser, and taking maximum value from each percentage of vuser.

The x-axis represents the percentage of total number of transaction time. The y-axis represents the transaction response time.
This graph shows average transaction time (time taken by each request and response) during each second of the simulation process.

The x-axis represents the elapsed time from the beginning of the script.
The y-axis represents the average transaction time.
This is a summary report, which briefly shows the status of the simulation process.

Date and Time is report generation time. 'Result of' is the file name from which this report is generated. Server is machine name on which load is generated.
Total number of vusers and iterations assigned to this script.
Bytes detail shows how much bytes send to server, and received from server and there average.
Number of Hits on server, number of response received from the server and there average shown in REQ/RES field.
Virtual User Status shows the total vuser, no of vuser
passed, failed and stopped.
This is the summary report of each vuser.
This is the simple report shows the total request and response bytes and time taken to complete the simulation process by particular vuser in particular iteration.
This report is classified based on Vuser, Content-Type, HTTP-Method, and HTTP-Status Code.

The above report is based on vuser, number of iteration is 4, Bytes is the total request and response bytes of all the vuser. Count is the number of operation or action i.e.,
10 vuser and 4 iteration in this example gives the value 40. Min, Max, Ave time of the vuser to complete its process.

The above table shows the content type classification report example. In this example four types are shown html, jpeg, png, and gif and there iteration value, Bytes is there
total request and response bytes, Count is the number of Hits of that type, and there min, max and ave time taken by that particular type.
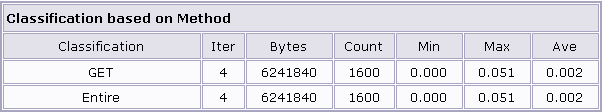
The above table shows the HTTP method based classification report example. In this example only GET method is available. Bytes is there total request and response bytes,
Count is the number of Hits of that type, and there min, max and ave time taken by that particular method.

The above table shows the HTTP Response Code based classification report example. In this example only 200 response code is available. Bytes is there total request
and response bytes, Count is the number of Hits of that type, and there min, max and ave time taken by that particular response code operation.
This report is the summary information of each file in the script.

Files column shows all the file names in the script. Iter is the total iteration performed on the file by the vuser, Count is the total Hits made by the vuser
with the particular file. Bytes is the total request and response bytes made by the particular file, and there min, max and ave time by each files are shown.
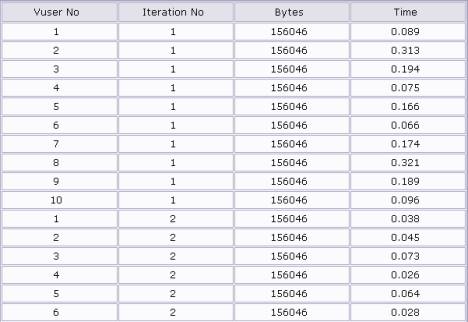
We can see the detail information about particular Vuser in particular iteration through this window

Select vuser number and iteration number to see its information. Here request information and response information are shown in two separate line.
File column
shows the file name to which actions are taking place. Action column shows the whether the operation is request or response. Start Time is beginning time of the action
and End Time is the completion time of the particular action. Time column shows the time taken to complete that particular action. Bytes column shows the total bytes
send to server for particular request action and total bytes received from the server for particular response action. Method column shows the name of the method used by
the request like GET, POST etc. Ftype column shows the file type or content type which is received from the server. And HttpCode column shows the server response
code.
The second list box shows the total request bytes, total response bytes and total bytes for particular vuser and iteration. min request time, min response
time, max request time, max response time, total request time, total response time, total time for particular vuser are shown.
We can see the detail information about a particular file through this window. To view detail information by Vuser Click here.

Select a file from drop down box to see its detail information. Here request information and response information are shown in two separate line.
first column
and second column shows the vuser number and iteration number to which actions are taking place. Action column shows the whether the operation is request or response.
Start Time is beginning time of the action and End Time is the completion time of the particular action. Time column shows the time taken to complete that particular
action. Bytes column shows the total bytes send to server for particular request action and total bytes received from the server for particular response action. Method
column shows the name of the method used by the request like GET, POST etc. Ftype column shows the file type or content type which is received from the server. And
HttpCode column shows the server response code.
The second list box shows min request time, min response time, max request time, max response time, average
request time and average response time for particular file are shown.
Select the appropriate report color and graph color using drop down box.

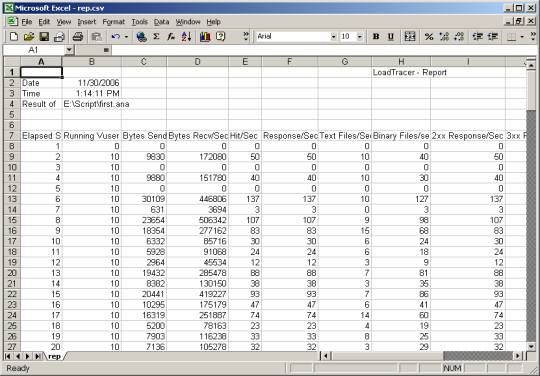
Reports Data Options: In the HTML report the values of the graph can be embedded in HTML page itself or the values can be shown in separate Excel Sheet by clicking the
link below the graph